Predictive maintenance relies on data: Having it, using it, and understanding it. Modern automated lines generate huge amounts of production data each shift, but little of that data is processed or utilized by maintenance engineers; Some programs track technical information such as robot temperature and physical condition, but so far no solution has offered on-site insights into process data.
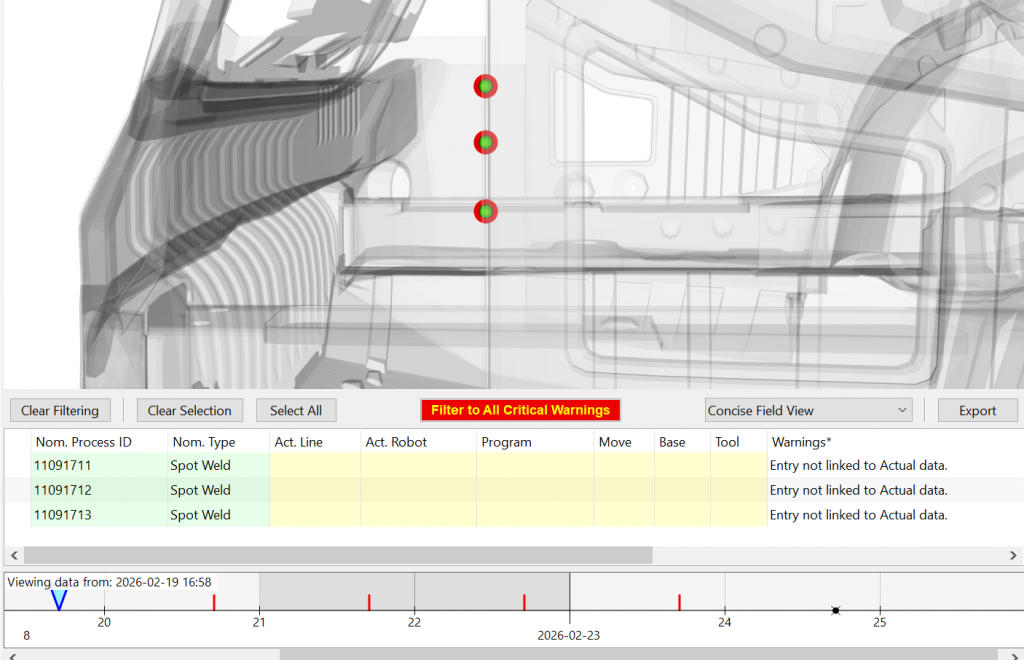
Inaccurate processes data corresponds to inaccurate results in tasks like welding and gluing, and can lead to recall-worthy issues like missed welds. RoboLive® visualizes trends, changes, and deviations in nominal instructions and actual results—helping you catch issues before they result in costly problems.
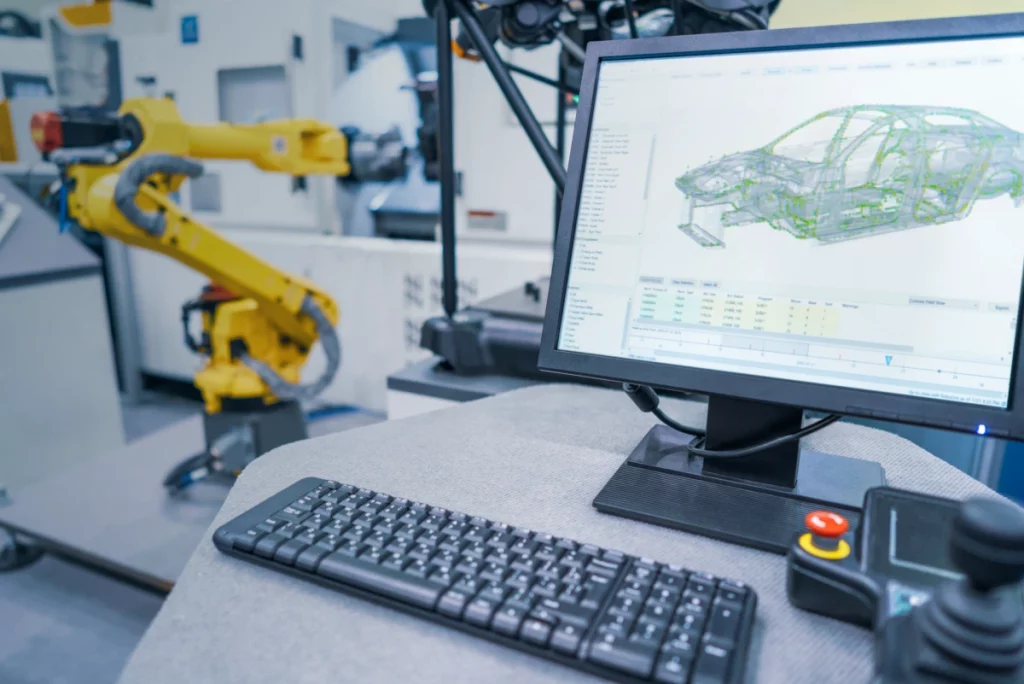
Process Visualization is the core of RoboLive®: Integrating your own product standards and recording data directly from the production robots themselves, the program visualizes your products with both nominal and actual process data in place. Warnings are produced when there’s an error such as a misnamed process, improperly applied base frame, or off location process—all in an intuitive form that can be understood by all staff at a glance. With this critical data at hand, you’ll have a more comprehensive understanding of factory conditions, and be empowered to make intelligent maintenance decisions.
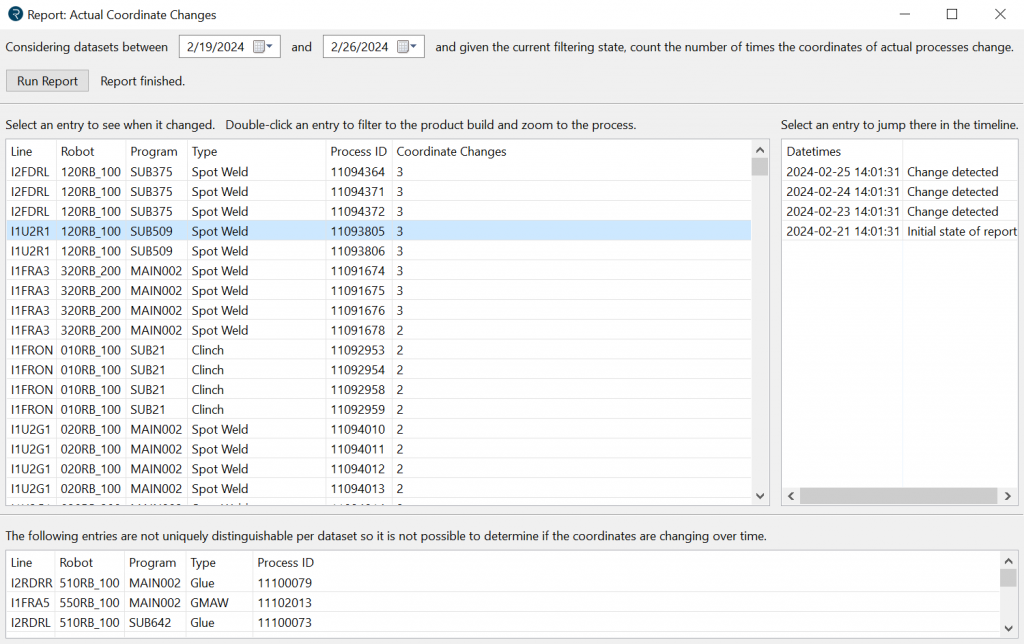
While Process Visualization is one of RoboLive®’s most powerful tools, the solution is capable of much more. RoboLive® automatically creates a historical record of your robot’s nominal and actual process data history. This data can be automatically processed into insightful reports that give you a look into operational details that otherwise would have gone unnoticed. The Actual Coordinate Changes Report, for example, identifies processes that have been repeatedly changed over given time frame, and when the changes took place. Frequent changes to a process could indicate a potential underlying issue with the robot or programming—and it’s information that can’t be readily accessed without RoboLive®.
RoboLive®’s data analysis tools come in another powerful form: the Process Warning Report Dashboard. This report compiles the amount, type, and impact of production warnings in your factory, tracked overtime. Using the Process Warning Report Dashboard, all staff can understand critical trends in your robots’ performance. With an easy way to assign custom impact values, it’s also a way to put a number to specific maintenance tasks and challenges.
The data processing and analysis capabilities of RoboLive® make it a powerful addition to any maintenance engineer’s toolkit. But that’s not all RoboLive® is capable of. The visualization core element can be used in routine production by robot programmers, plant managers, QA teams, and at every step in the manufacturing process. Even during commissioning and handoff, RoboLive® offers a simple way to bridge the gap between simulation and reality.
See RoboLive® in action today with a free consultation or demonstration—just reach out to an expert on our website or LinkedIn. Demo downloads of the RoboLive® client are available on request, and manufacturers are currently welcome to request a custom pilot or installation with custom data for an even closer look at how RoboLive® works.